It starts with a conversation.
Your organization started its Azure journey hoping to move faster, with greater technical velocity and lower cost. Along the way, the connection between business goals and Azure usage was lost (or perhaps, it never existed). To understand where things have gone off-track, let’s have a cross-team conversation involving all the key stakeholders. I start modestly, with a specific line of business or project to demonstrate the value. Once we’ve established a baseline of success, the cost management model can be expanded to more lines of business that use Azure.
Our method is…

DATA
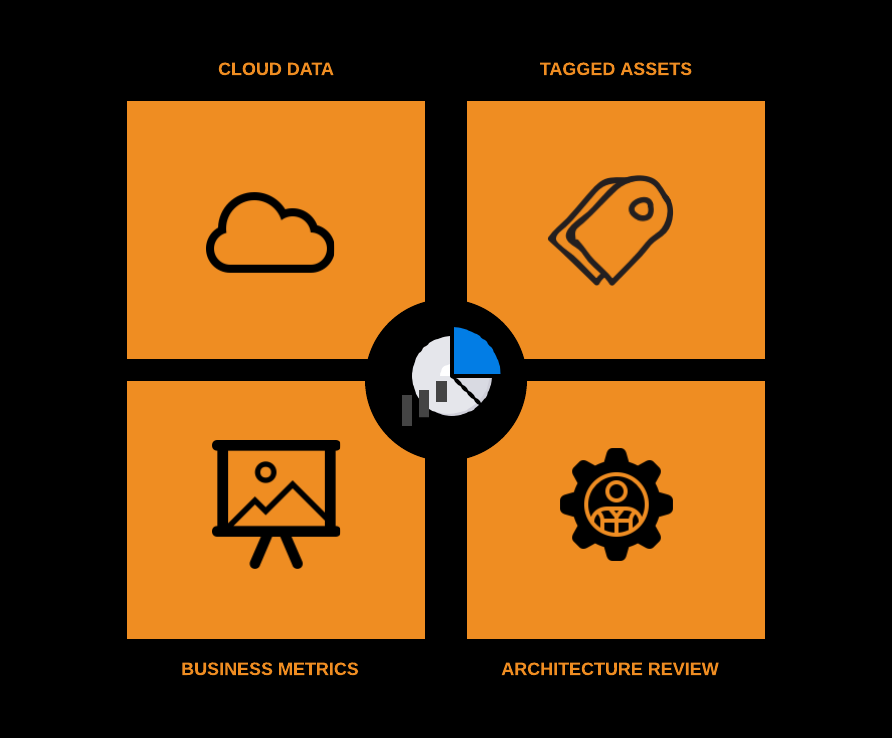
We gather data from your Azure environment using the platform’s native APIs, billing and consumption exports and the built-in Azure Cost Explorer tool. This technical information is combined with the contextual, business information you provide during our conversations.
This information - which is a synthesis of raw data and business insight - forms the foundation for our analysis.

ANALYSIS
Azure consumption data and business context are analyzed to find opportunities for cost reduction and use optimization. This is where experience (and listening) matters most. For example, perhaps your team has deployed resources that are more than what’s needed, or not taking advantage of Azure Reservations and hybrid-use benefit.
Using a variety of tools, including the Azure Cost Explorer, TabIeau, PowerBI, Excel, Powerboard, and the observability tooling your organization prefers (such as Cloudability), we analyze these gaps to help you increase efficiency and realize benefits.

REPORT
After a careful analysis we produce a report, tailored to your needs that describes specific areas for savings and optimization such as:
Under-utilized and over-provisioned resources
The state of tagging in your environment (is tagging used to identify business purpose?)
Opportunities to use reservations and hybrid benefit
Opportunities to optimize architecture for cost
The performance of your Azure environments relative to business objectives (budget and revenue)
Time-series analysis of your Azure spending trends and detailing of the cost drivers
Opportunities to use policies and budgets to manage spending
Here’s an example of the type of report you’ll receive.
If you opt for the our forecasting and monitoring service, we’ll also provide a tailored dashboard and alerts of anomalous spending so you’ll never be surprised.
Visualize your Azure Spend Using Powerboard
Monroelab uses a variety of analytical tools to help you understand your spending patterns including Powerboard, a cloud management platform for Azure. In this video, we show Powerboard’s capabilities.
A walkthrough of Powerboard, an Azure cloud management platform